
Introduction to Grafana
Are you ready to visualize your data like never before? Enter Grafana, the powerful open-source platform that revolutionizes dashboard creation and data visualization. Join us on a journey through Grafana's core components as we dive into setting up data sources, crafting dynamic dashboards, and unleashing the full potential of your data. Let's explore how Grafana can elevate your monitoring and analytics game to new heights!
What is Grafana?
Grafana is a powerful open-source platform that enables users to visualize and monitor data in real-time. It acts as a centralized hub for creating interactive dashboards, making it effortlessly easier to analyze complex datasets. Whether you're an IT professional, developer, or data analyst, Grafana provides the tools needed to gain valuable insights from your data.
With its user-friendly interface and customizable features, Grafana allows users to connect to various data sources such as databases, APIs, and cloud services seamlessly. This flexibility makes it a versatile tool for businesses looking to track key performance indicators or monitor system metrics efficiently.
In addition to its visualization capabilities, Grafana supports collaboration by allowing teams to share dashboards and work together on projects. By harnessing the power of Grafana's core components effectively, users can create dynamic dashboards that provide actionable insights at a glance.
Know More: https://grafana.com/
History and evolution of Grafana
Grafana, a powerful open-source data visualization tool, has an intriguing history and evolution that has shaped its current state as a widely used platform in the tech world.
Created by Torkel Ödegaard in 2014, Grafana quickly gained popularity among developers and data enthusiasts for its user-friendly interface and robust features. Over the years, it has continued to evolve with regular updates and enhancements to meet the changing needs of its users.
With each new version release, Grafana introduces innovative functionalities and improvements that make dashboard creation and data monitoring even more seamless and efficient. Its community-driven development approach ensures that feedback from users is taken into account, resulting in a tool that is constantly improving.
As Grafana continues to grow and adapt to the evolving landscape of data visualization tools, it remains at the forefront of innovation, setting new standards for dynamic dashboard building.
How to Use Grafana
When it comes to using Grafana, the process can be broken down into a few key steps that make dashboard creation a smooth experience. The first step is setting up a data source, which involves connecting Grafana to your database or API where the data resides. This allows Grafana to pull in real-time information for visualization.
Next, creating a dashboard involves selecting the type of visualization you want to use and arranging it in a layout that makes sense for your data presentation needs. Adding panels and visualizations helps bring your data to life, making it easier to interpret and analyze at a glance.
Customizing the dashboard layout and design is where you can make it your own. Whether it's adjusting colors, and font sizes, or adding annotations, Grafana offers plenty of customization options to tailor the dashboard to your preferences.
Get Started: https://grafana.com/docs/grafana/latest/getting-started/>Setting up a data source
Setting up a data source in Grafana is the first step to building dynamic dashboards that provide valuable insights. A data source acts as a bridge between your data and Grafana, allowing you to visualize information from various databases or applications.
To set up a data source in Grafana, you need to access the configuration settings within the platform. From there, you can select the type of database or service where your data resides, such as Prometheus, InfluxDB, MySQL, or others.
After selecting the appropriate data source type, you will need to input specific connection details like server address, credentials, and any other required parameters. Once configured correctly, Grafana will establish a connection to your chosen data source and enable you to start creating interactive dashboards.
Having a solid understanding of how to set up and configure a data source in Grafana is crucial for unlocking its full potential in visualizing and analyzing your data effectively.
Creating a dashboard
Creating a dashboard in Grafana is where the magic happens. It's your canvas to visualize data like never before. With just a few clicks, you can bring your data to life and gain valuable insights at a glance.
Start by selecting the data source you want to use for your dashboard. Whether it's Prometheus, InfluxDB, or another supported database, Grafana makes it easy to connect and fetch the data you need.
Next, choose the visualization panels that best represent your data - from graphs and tables to gauges and heatmaps. Customize each panel with specific queries and settings to tailor them to your requirements.
Arrange these panels on your dashboard layout intuitively. Drag and drop them into place, resize them as needed, and create a visually appealing design that tells a story with your data.
Experiment with different visualizations, color schemes, and layouts until you achieve the perfect balance of functionality and aesthetics in your dynamic Grafana dashboard.
Know More: https://grafana.com/docs/grafana/latest/getting-started/build-first-dashboard/Adding panels and visualizations
When building dynamic dashboards in Grafana, adding panels and visualizations is where the magic happens. Panels are the building blocks of your dashboard, displaying data in various formats such as graphs, tables, or gauges. Visualizations help you make sense of complex data by presenting it in a clear and understandable way.
Grafana offers a wide range of visualization options to choose from, including bar charts, pie charts, heatmaps, and more. You can customize each panel to show specific metrics or data points that are most relevant to your monitoring needs. With just a few clicks, you can create visually appealing displays that provide valuable insights at a glance.
By combining different panels and visualizations on your dashboard, you can create a comprehensive overview of your data sources and systems. Whether you're tracking server performance metrics or analyzing log data trends, Grafana's intuitive interface makes it easy to design informative dashboards tailored to your requirements.
Know More: https://grafana.com/docs/grafana/latest/panels-visualizations/Customizing dashboard layout and design
One of the key features that sets Grafana apart is its flexibility in customizing dashboard layout and design. With a user-friendly interface, you can easily rearrange panels, resize them, and choose from various visualization options to create a truly dynamic dashboard.
Customizing the layout allows you to prioritize information based on importance or relevance. You can experiment with different configurations to find the most effective way to present your data visually.
In terms of design, Grafana offers a wide range of customization options such as color schemes, fonts, and backgrounds. This enables you to tailor the dashboard's appearance according to your preferences or corporate branding guidelines.
By taking advantage of these customization features, you can create personalized dashboards that not only look visually appealing but also convey information efficiently.
Understanding Dashboards in Grafana
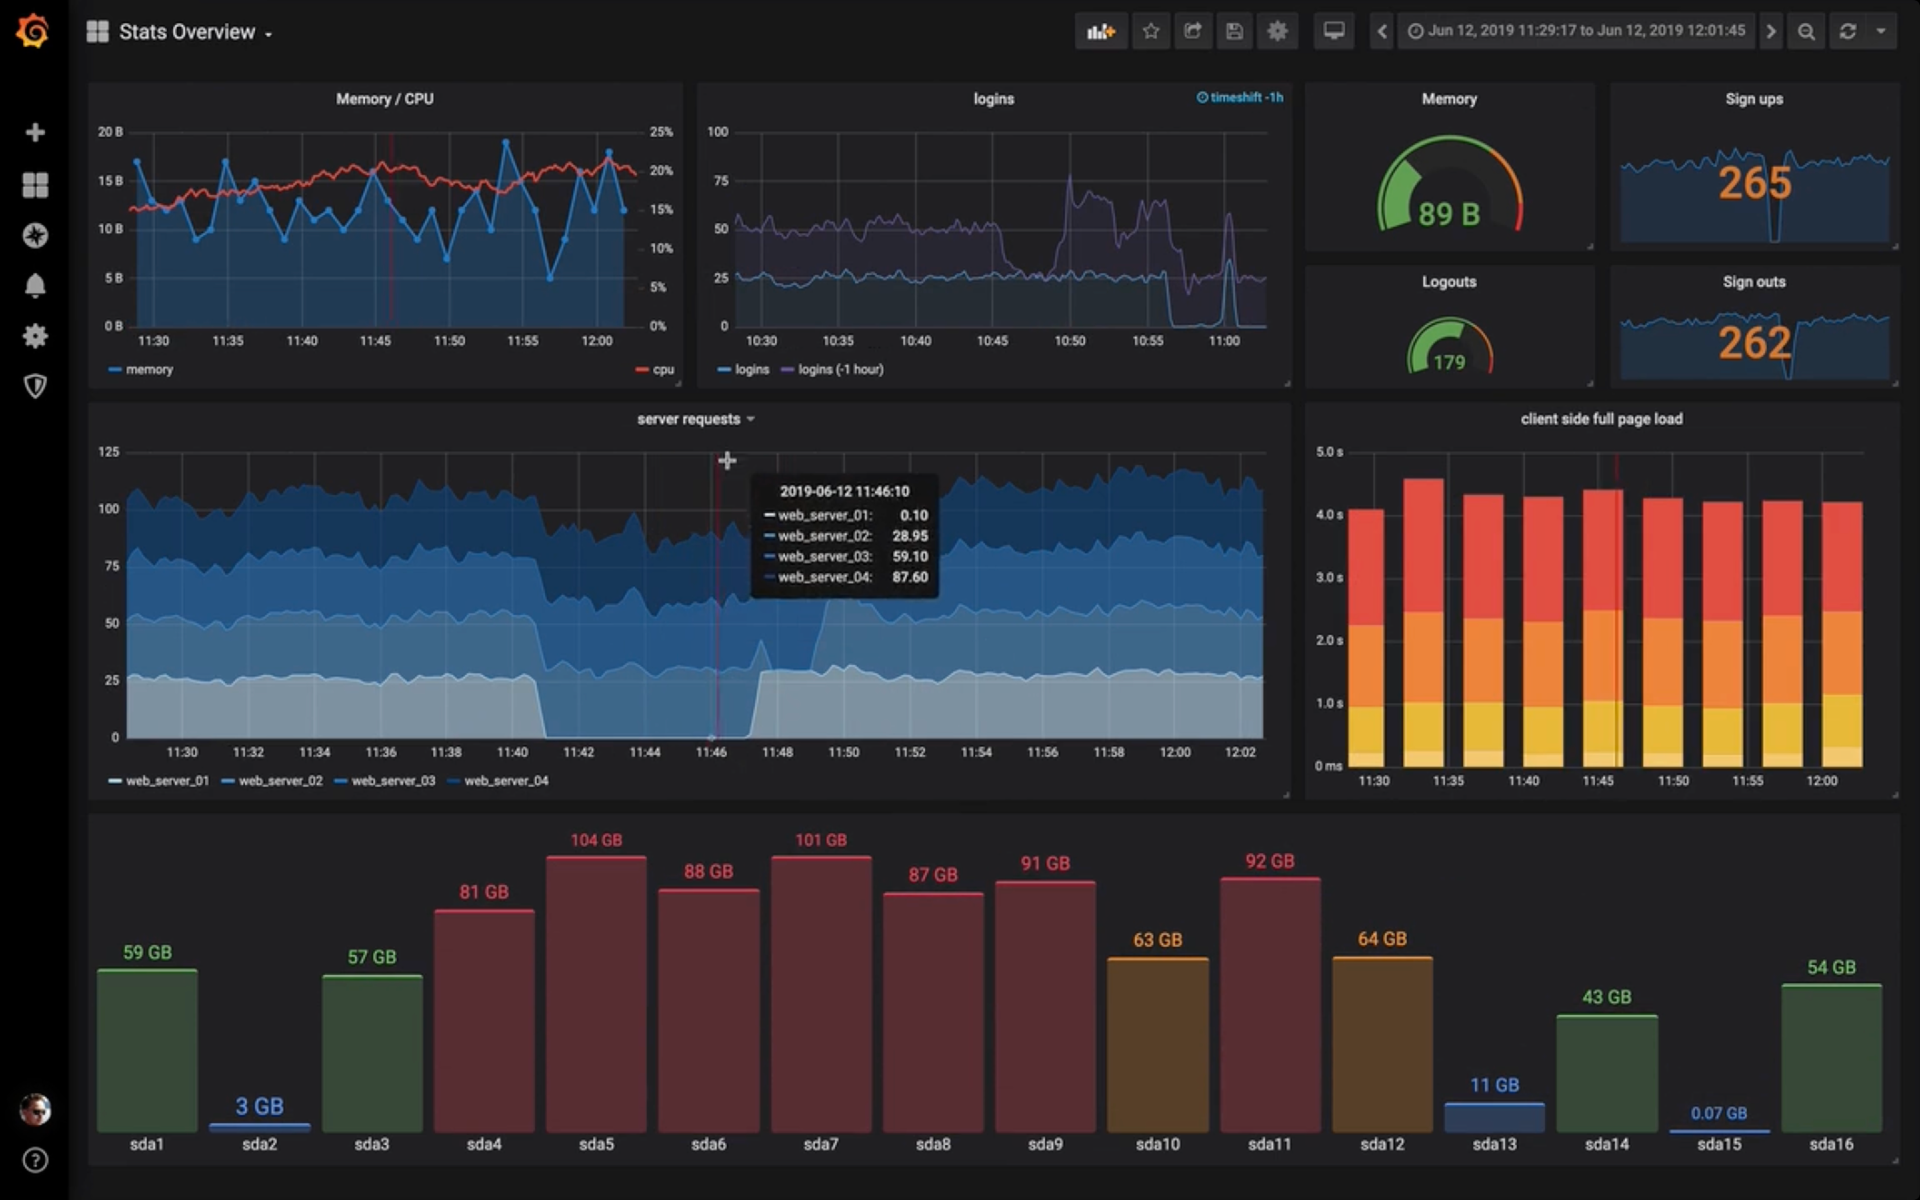
Dashboards in Grafana are like a canvas where you can paint a vivid picture of your data. They serve as a visual representation of key metrics and insights, helping users make informed decisions at a glance.
In Grafana, there are different types of dashboards to choose from depending on your needs. You can opt for template or non-template dashboards, each offering unique advantages. Template dashboards allow for dynamic filtering and customization based on variables, while non-template dashboards provide a fixed layout.
Another distinction to consider is between static and dynamic dashboards. Static dashboards display pre-defined data without any interactivity, ideal for showcasing standard reports. On the other hand, dynamic dashboards offer real-time updates and interactive elements, enabling users to explore data dynamically.
Ultimately, understanding the nuances of different dashboard types empowers users to create tailored visualizations that effectively communicate their data story in Grafana.
Know More: https://grafana.com/docs/grafana/latest/dashboards/Definition and purpose of dashboards
Dashboards in Grafana serve as a centralized hub for visualizing and monitoring data from various sources. They provide an intuitive interface for users to track key metrics, identify trends, and make informed decisions based on real-time information. The purpose of dashboards is to simplify complex data sets into easy-to-understand visuals that help stakeholders gain valuable insights at a glance.
By incorporating different panels and visualizations within the dashboard layout, users can customize their view to focus on specific datasets or KPIs. Whether it's line charts, bar graphs, gauges, or heatmaps, Grafana offers a wide range of visualization options to suit diverse monitoring needs.
Dynamic dashboards allow for real-time updates and interactive elements that adapt to changing data inputs automatically. On the other hand, static dashboards display fixed content without any dynamic behavior. Choosing between template vs non-template dashboards depends on whether you want flexibility in panel configurations or standardized layouts across multiple dashboards respectively.
Understanding these core components of Grafana is essential for creating effective and user-friendly dashboards tailored to your monitoring requirements.
Conclusion
In conclusion, Grafana is a powerful open-source platform that allows users to create dynamic and informative dashboards. By setting up data sources, customizing layouts, and choosing the right visualizations, you can transform complex data sets into easily understandable visuals. With its wide range of features and user-friendly interface, Grafana empowers users to gain valuable insights from their data and make data-driven decisions.