DevOps is constantly changing as new tech hits the scene. This means monitoring tools need to keep up! Staying on top of your DevOps game requires using the latest, most powerful tools. These tools go beyond just keeping things running smoothly; they can also make your teams much more productive. This blog will dive deep into DevOps monitoring, what you should keep track of, and most importantly, the monitoring tools to check out.
Keeping Your DevOps Pipeline Healthy: What to Monitor
Smooth sailing in DevOps requires constant vigilance. Here's what you need to keep an eye on:
- Application Performance (APM): Make sure your apps run smoothly by tracking response times, errors, and resource usage. Unhappy users and lost sales are no fun!
- Infrastructure Health: Keep tabs on your servers, VMs, containers, and cloud resources. Monitoring CPU, memory, disk space, and network activity helps you spot problems before they bring things down.
- Network Performance: Reliable networks are essential for modern applications. Track latency, throughput, and packet loss to identify and fix network issues that could slow things down.
- Cloud Costs: In the cloud, keeping an eye on spending is key. Cost monitoring tools help you see where your money goes, identify waste, and optimize resource use.
Top DevOps Monitoring Tools
In the world of DevOps, maintaining visibility across the entire application delivery lifecycle is crucial. With the rise of complex architectures, continuous integration, and continuous deployment (CI/CD) pipelines, it's essential to have a diverse set of monitoring tools at your disposal. Open-source tools offer flexibility, customization, and community support, making them ideal for DevOps teams. In this guide, we'll explore some of the most popular open-source DevOps monitoring tools, categorized by their core functionality.
Infrastructure Monitoring
Prometheus
Prometheus is a leading open-source monitoring solution known for its powerful time series database, flexible querying, and robust alerting capabilities. It's designed to handle high-dimensional data, making it perfect for monitoring and alerting on metrics from servers and applications.

Features:
- Time Series Database
- Powerful Querying
- Alerting Capabilities
Use Cases: Monitoring and alerting on metrics from servers and applications
Nagios
Nagios is a veteran in the monitoring space, offering a comprehensive solution with an extensive plugin ecosystem. It provides monitoring and alerting for network, server, and application performance.
Features:
- Extensive Plugin Ecosystem
- Alerting
- Reporting
Use Cases: Network, Server, and Application Monitoring
Log Management
ELK Stack (Elasticsearch, Logstash, Kibana)
The ELK Stack is a powerful trio for centralized logging, real-time search, and analysis. Elasticsearch handles the storage and indexing of log data, Logstash processes and transforms logs, and Kibana provides a robust interface for visualizing log data.
Features:
- Centralized Logging
- Real-Time Search
- Analysis
Use Cases: Log Aggregation, Analysis, and Visualization
Graylog
Graylog is another excellent open-source tool for log management, offering real-time search and analysis. It simplifies the collection, indexing, and analysis of log data from various sources.
Features:
- Log Management
- Real-Time Search
- Analysis
Use Cases: Collecting, Indexing, and Analyzing Log Data
Application Performance Monitoring (APM)
Grafana
Grafana is renowned for its beautiful dashboards and data visualization capabilities. It integrates seamlessly with various data sources, including Prometheus, to provide insightful visualizations and alerting.
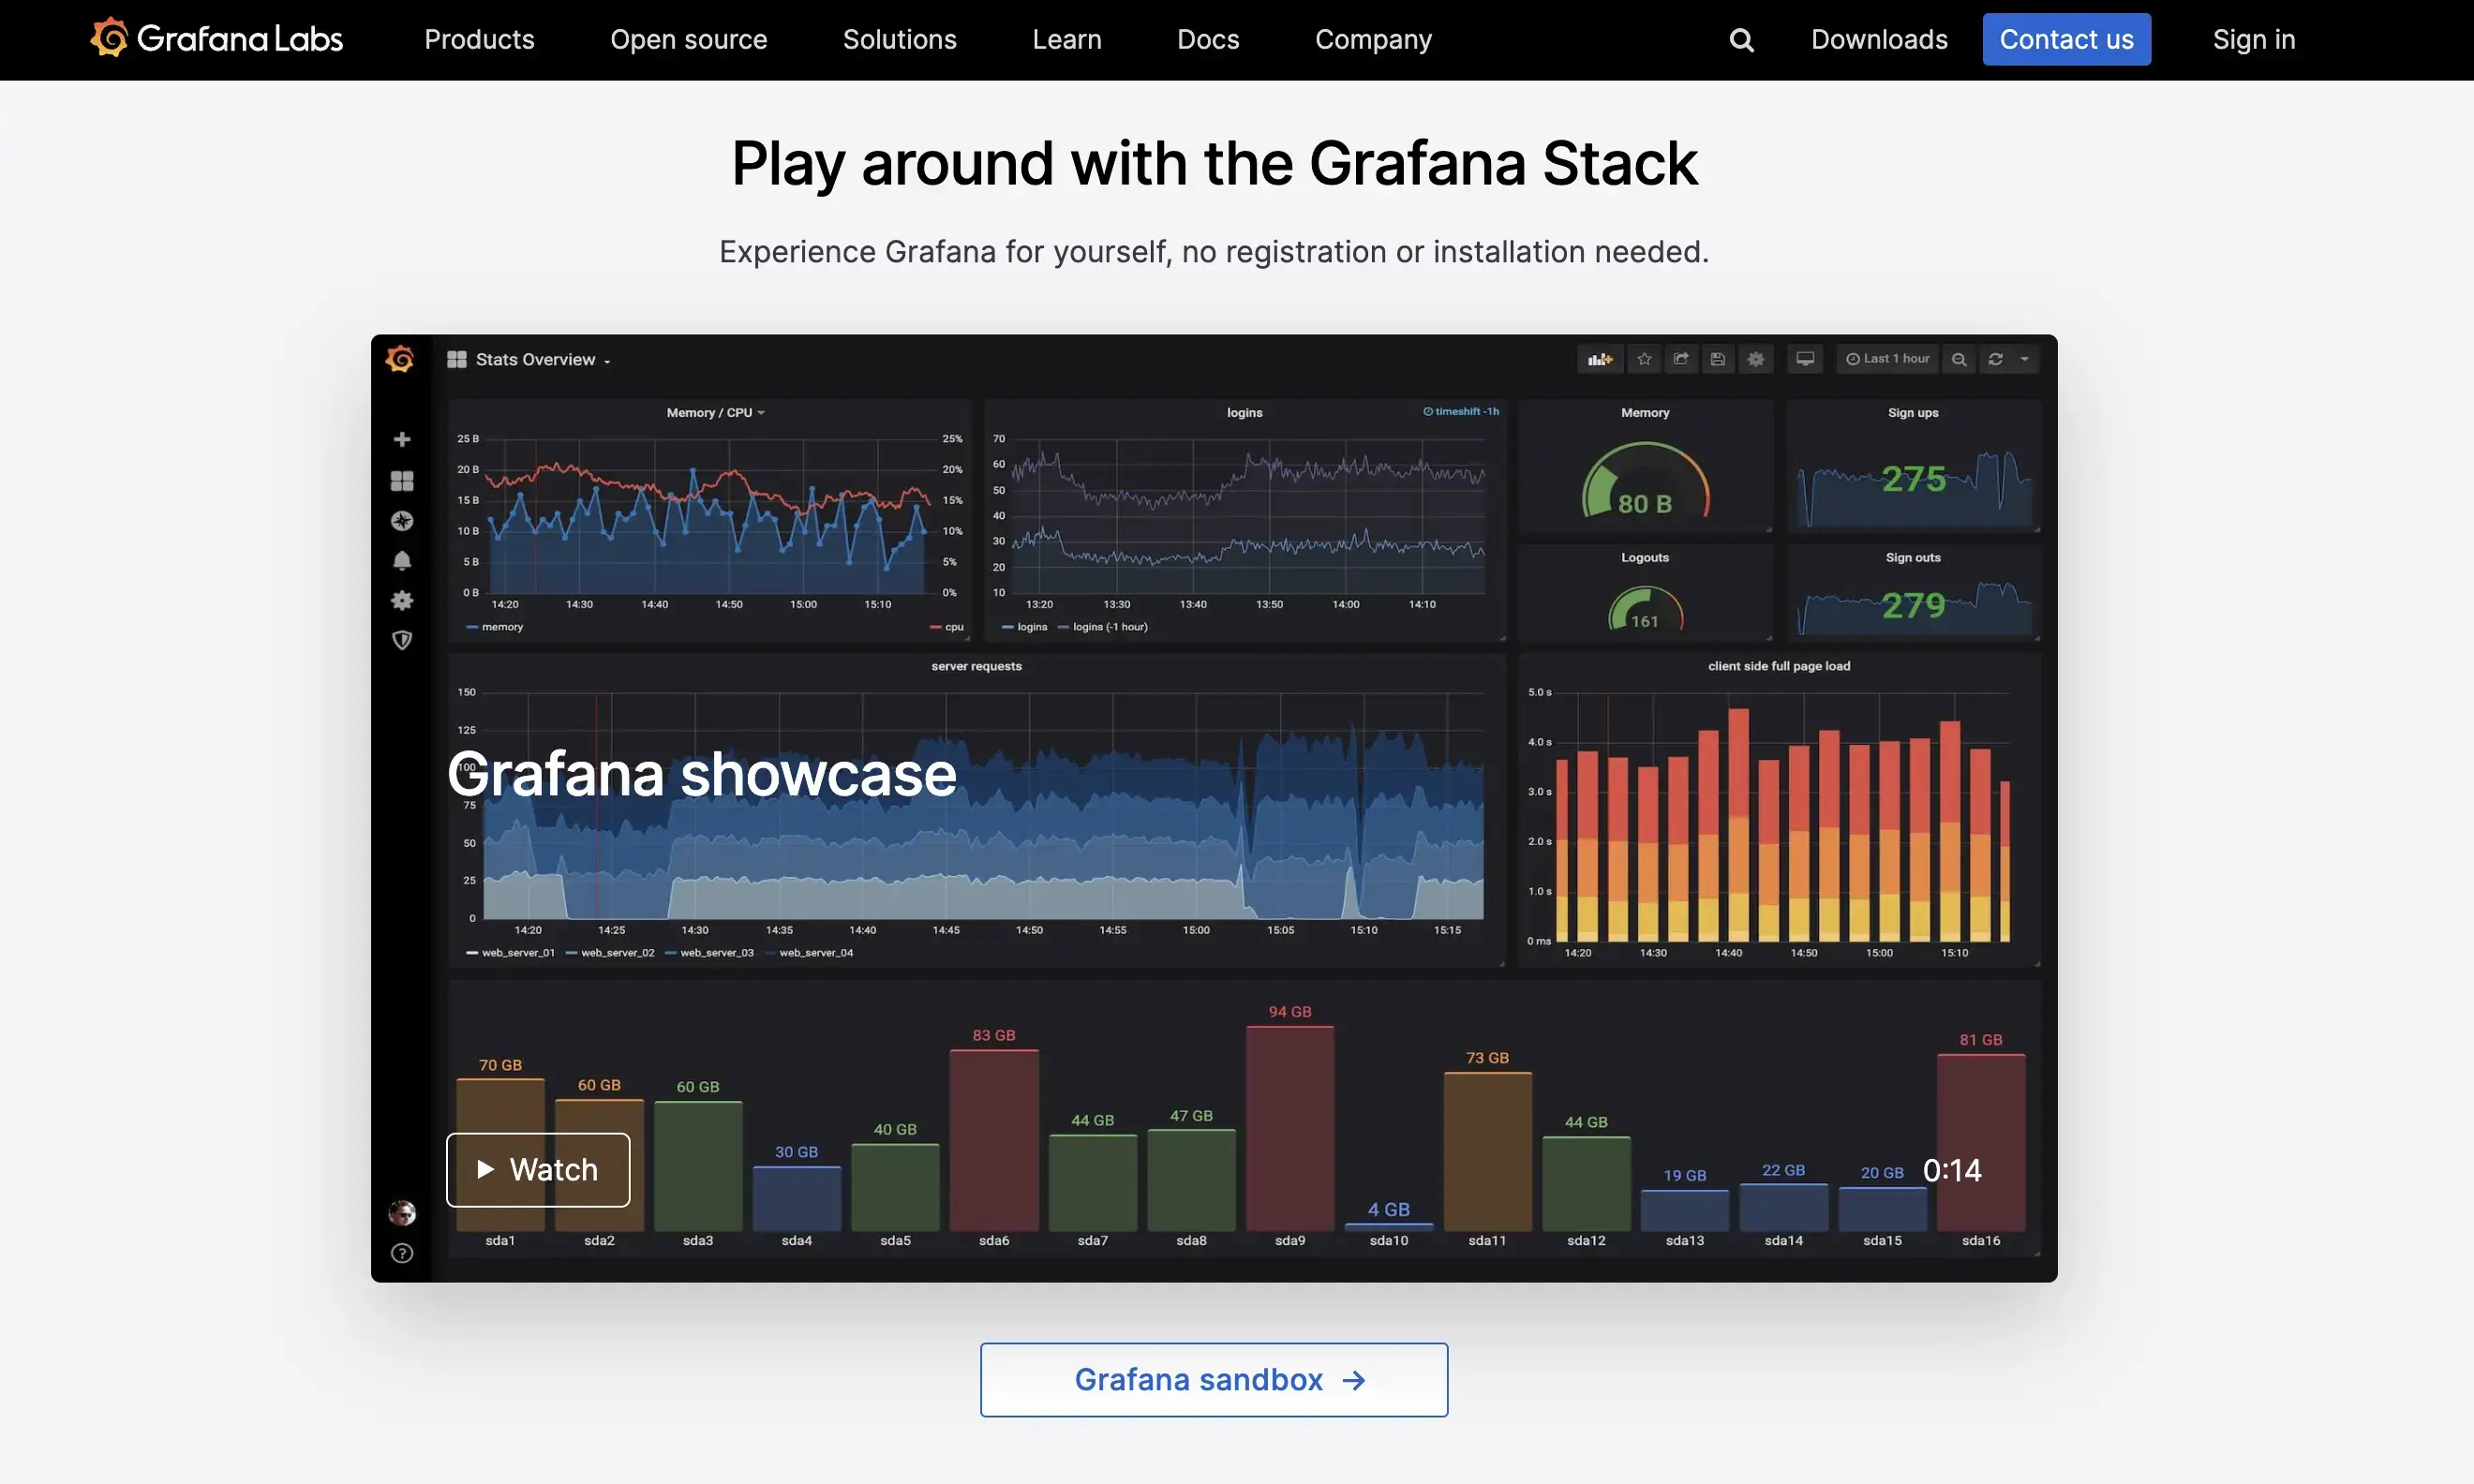
Features:
- Dashboard Creation
- Data Visualization
- Alerting
Use Cases: Visualizing Time-series Data, Integrating with Prometheus and other data sources
Jaeger
Jaeger is an open-source tool for distributed tracing, crucial for monitoring and troubleshooting microservices-based applications. It helps to track the performance and trace transactions across services.
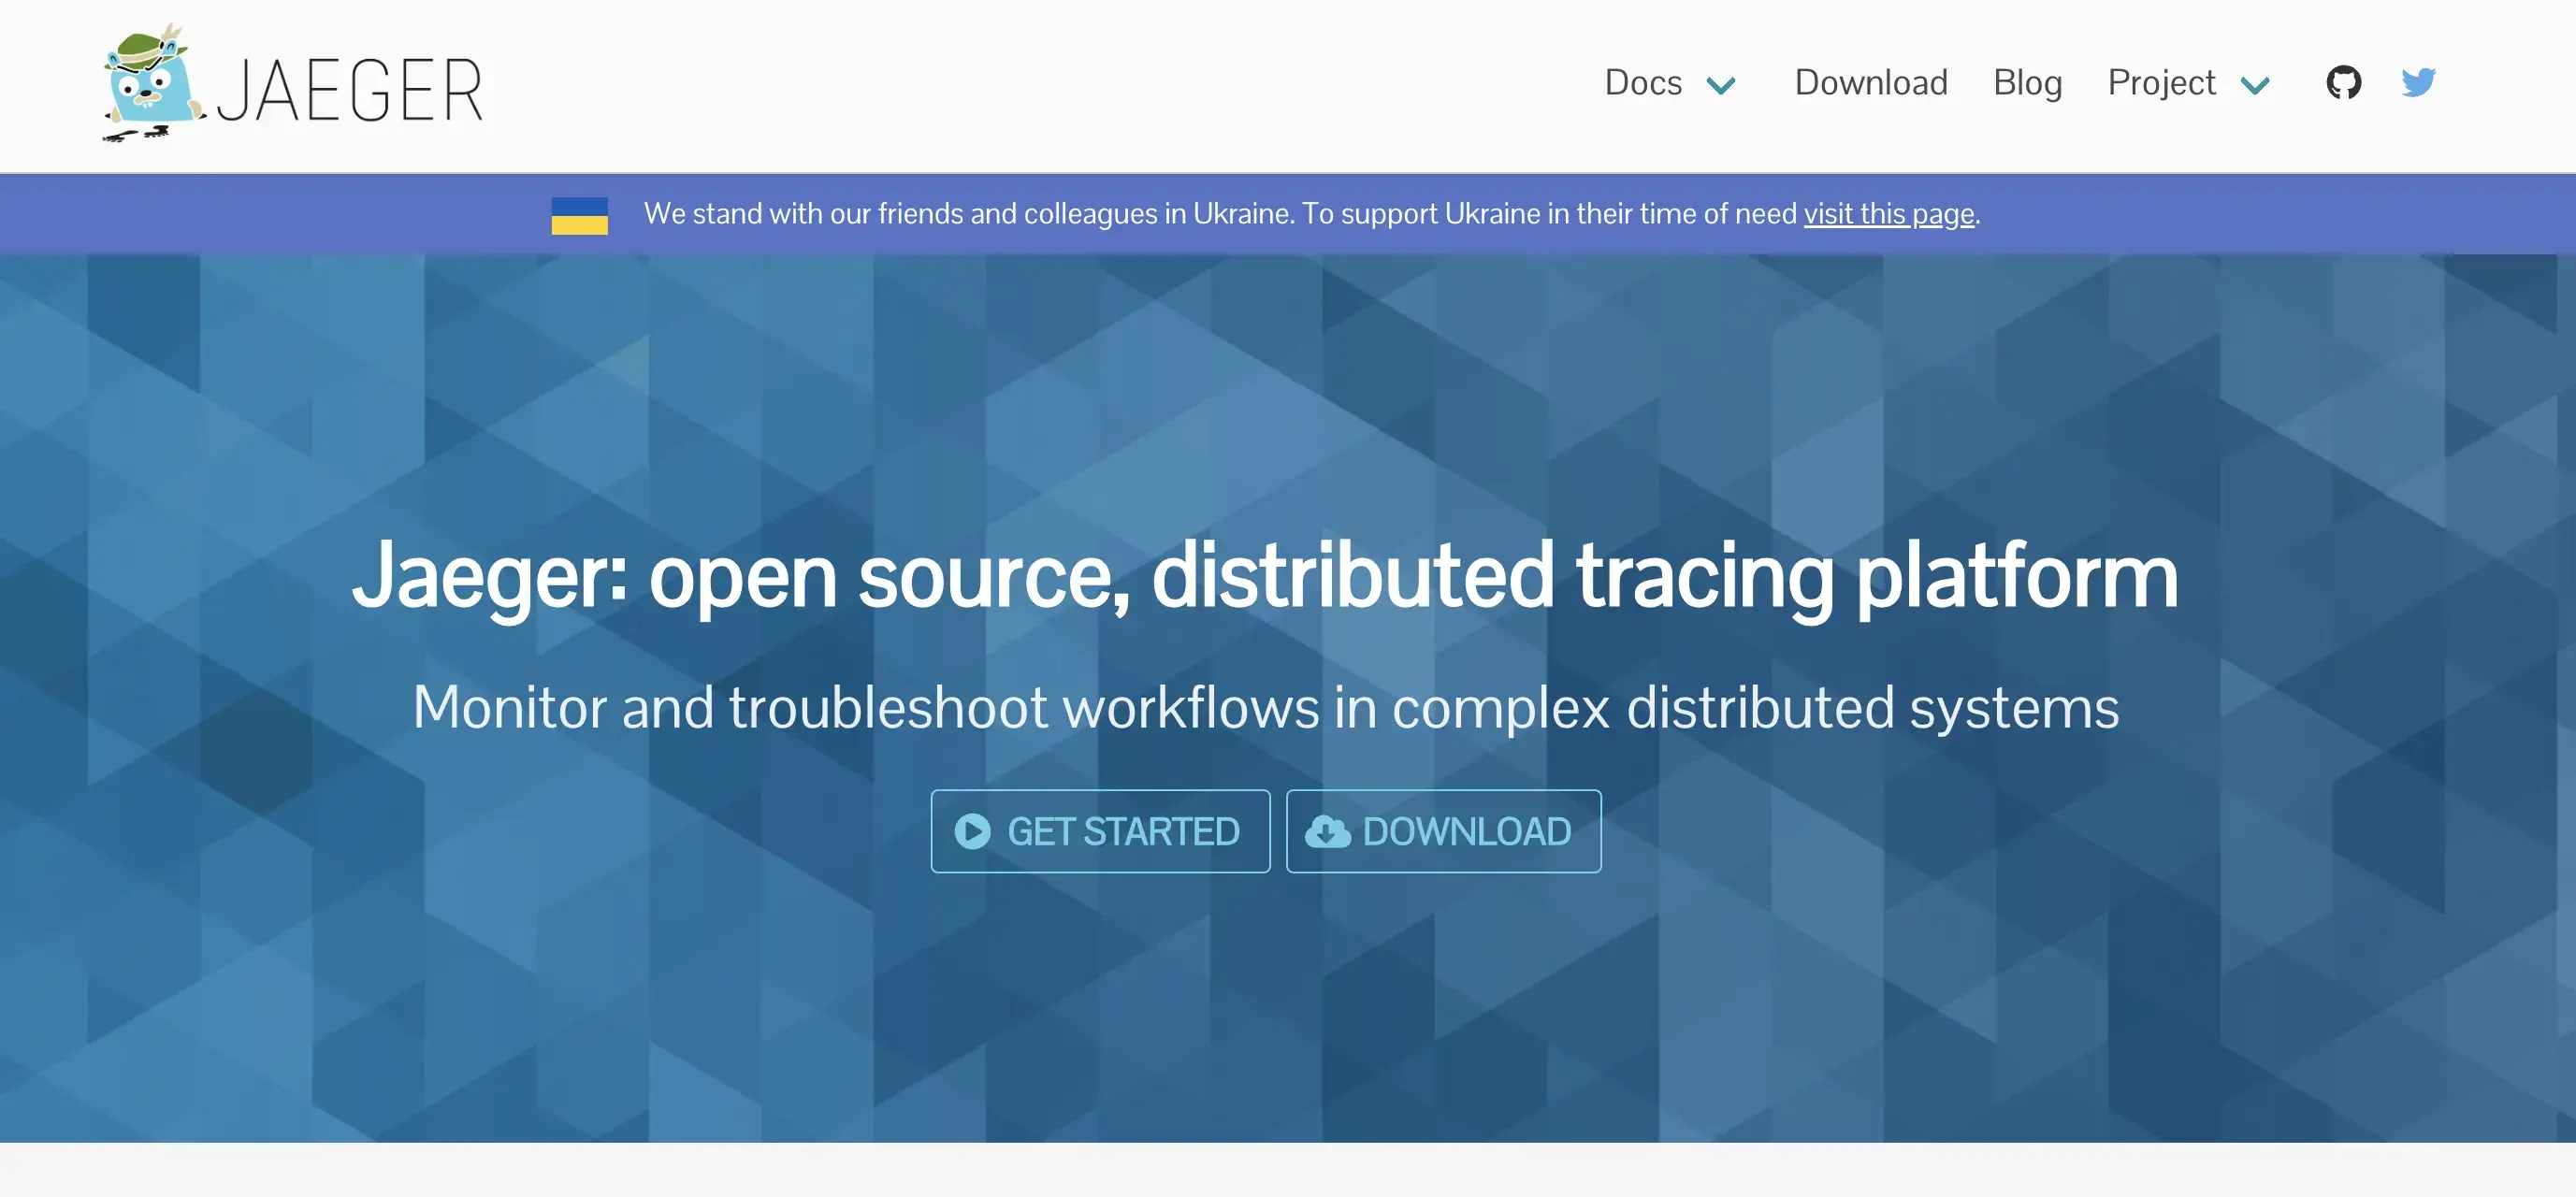
Features:
- Distributed Tracing
- Performance Monitoring
Use Cases: Tracing and analyzing transactions in microservices architectures
Network Monitoring
Zabbix
Zabbix provides comprehensive network monitoring, alerting, and reporting capabilities. It's designed to monitor network performance, server health, and application metrics.
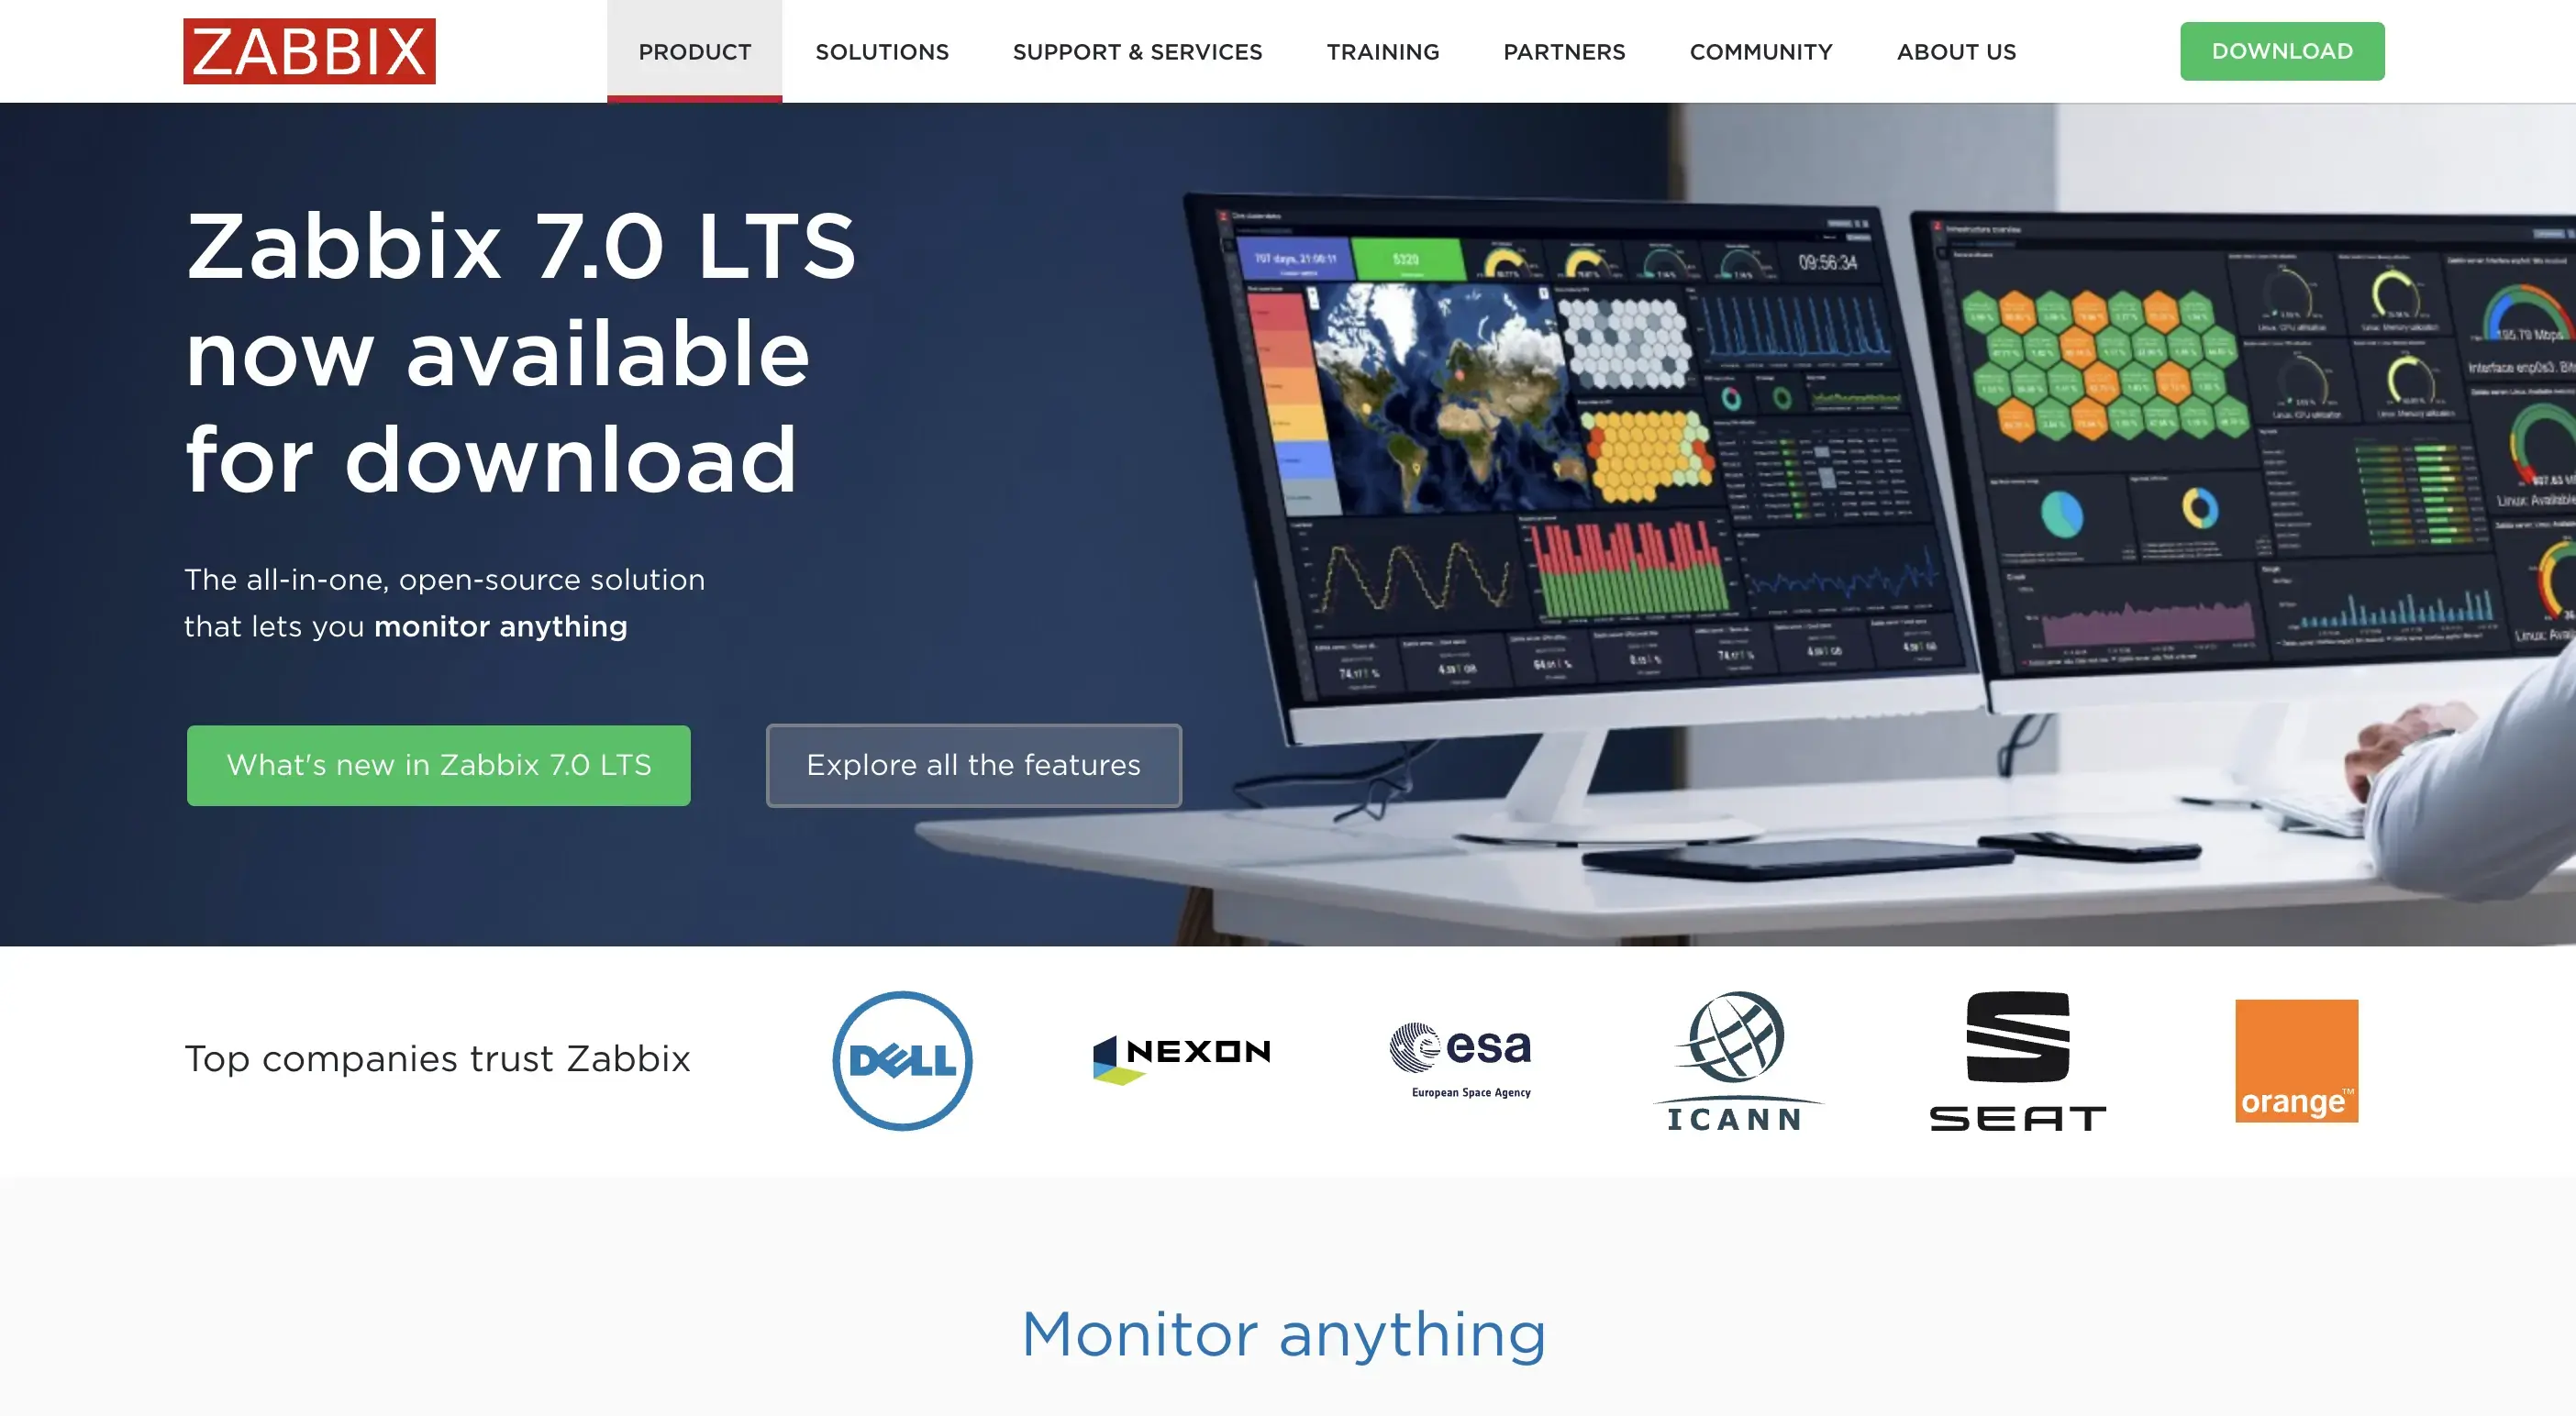
Features:
- Network Monitoring
- Alerting
- Reporting
Use Cases: Monitoring Network Performance, Server Health
Cacti
Cacti is a network graphing solution that enables the visualization of network traffic and performance over time. It's ideal for monitoring bandwidth usage and identifying trends.
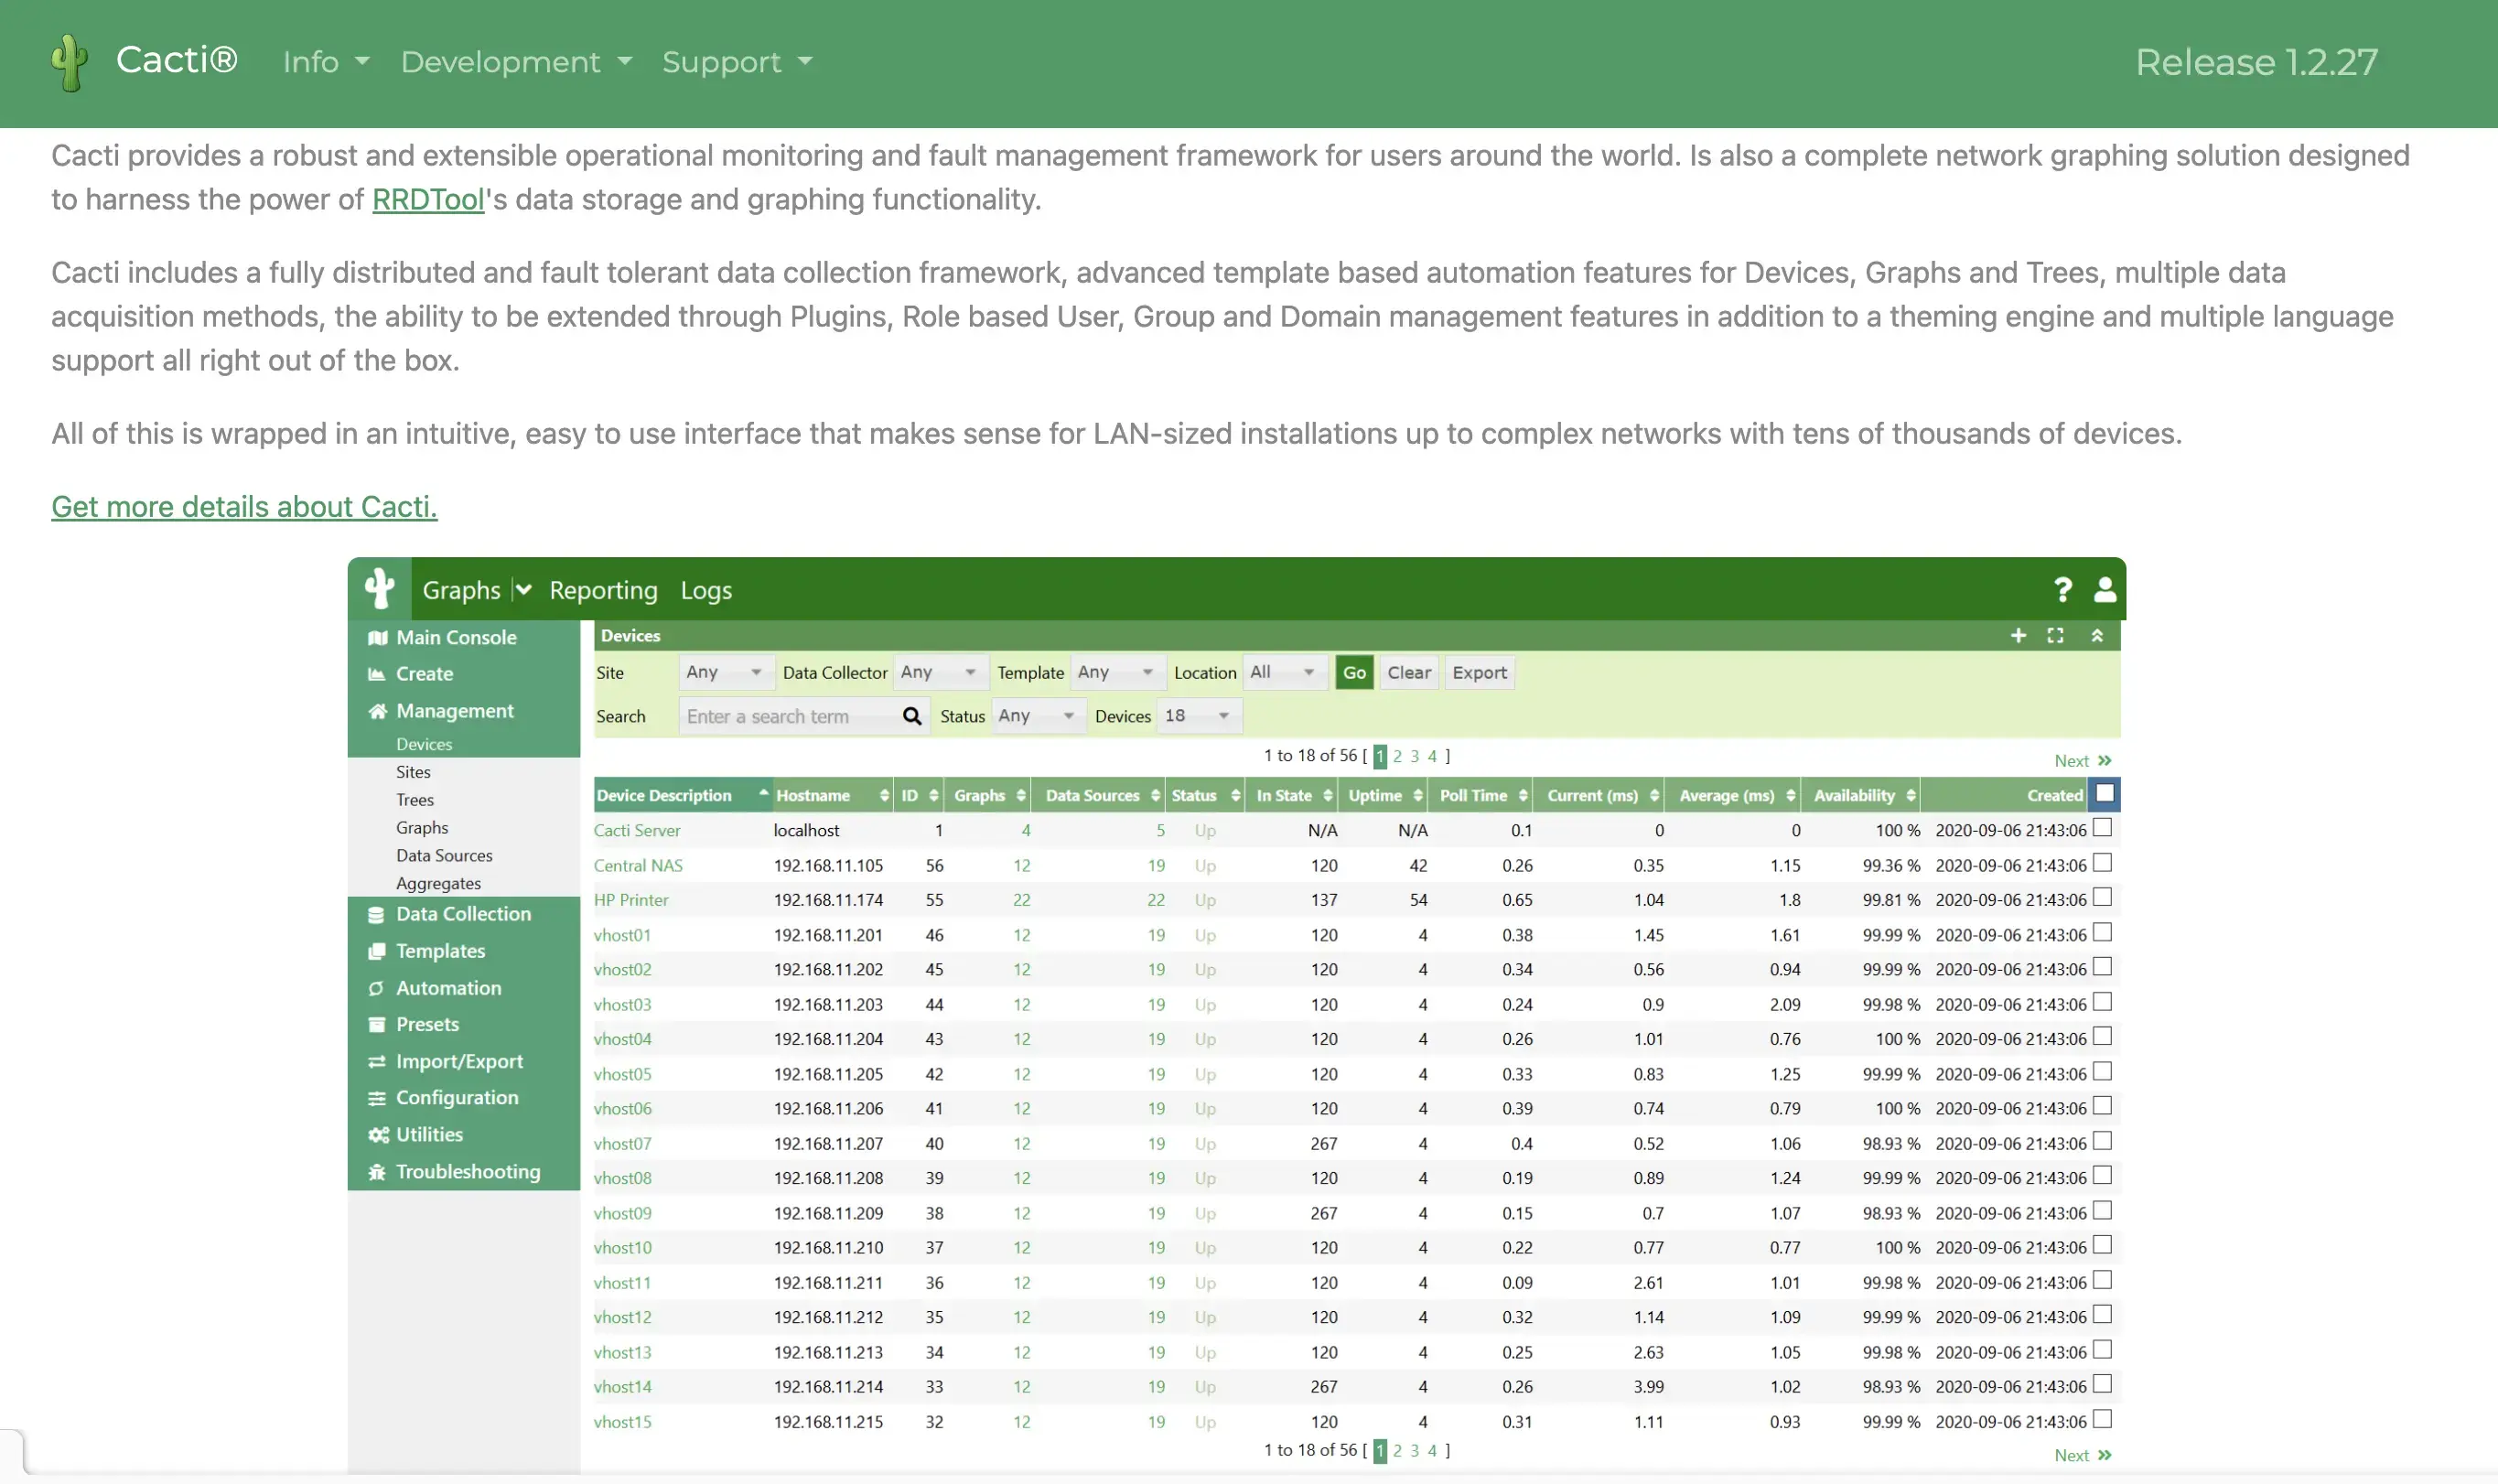
Features:
- Network Graphing
- Monitoring
Use Cases: Visualizing network traffic and performance over time
Container and Orchestration Monitoring
cAdvisor
cAdvisor is a container monitoring tool that provides insights into resource usage and performance. It's particularly useful for monitoring Docker containers and ensuring optimal performance.
Features:
- Network Monitoring
- Alerting
- Reporting
Use Cases: Monitoring Docker containers
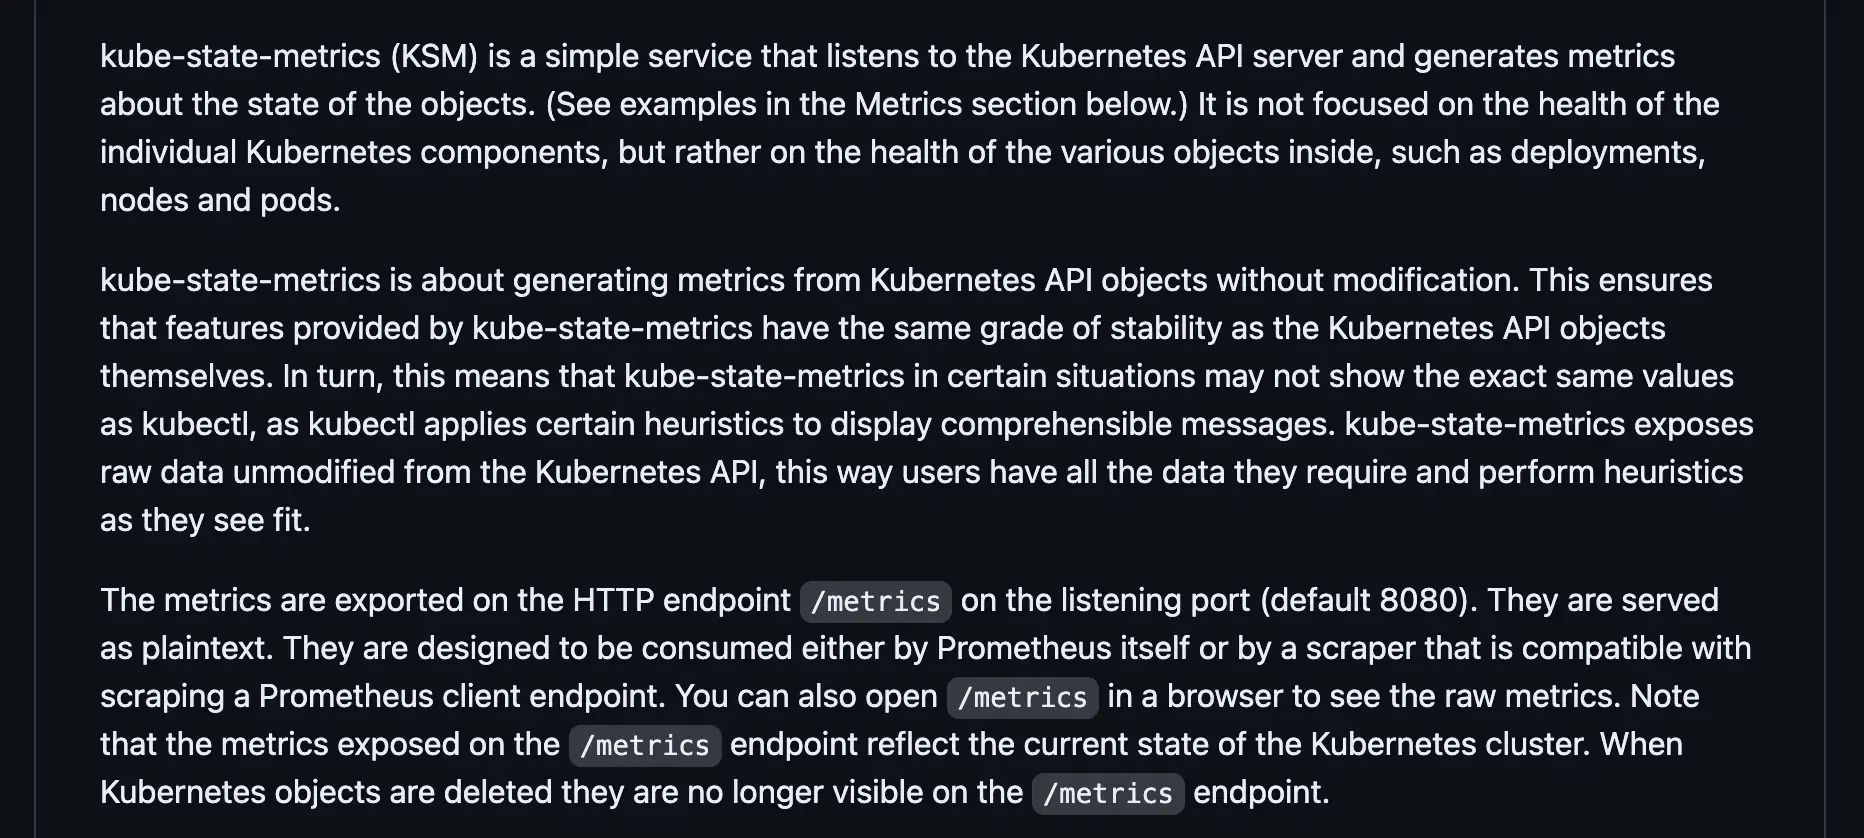
Kube-State-Metrics
Kube-State-Metrics is designed for monitoring Kubernetes clusters. It exposes cluster state metrics, helping you track the health and performance of your Kubernetes environment.
Features:
- Kubernetes Cluster State Metrics
Use Cases: Monitoring the health and performance of Kubernetes clusters
Summary
Having the right monitoring tools is essential for maintaining the health and performance of your infrastructure and applications. The open-source tools listed in this guide offer robust features and community support, making them excellent choices for any DevOps team. By leveraging these tools, you can gain comprehensive visibility into your systems and ensure a smooth, efficient application delivery lifecycle.